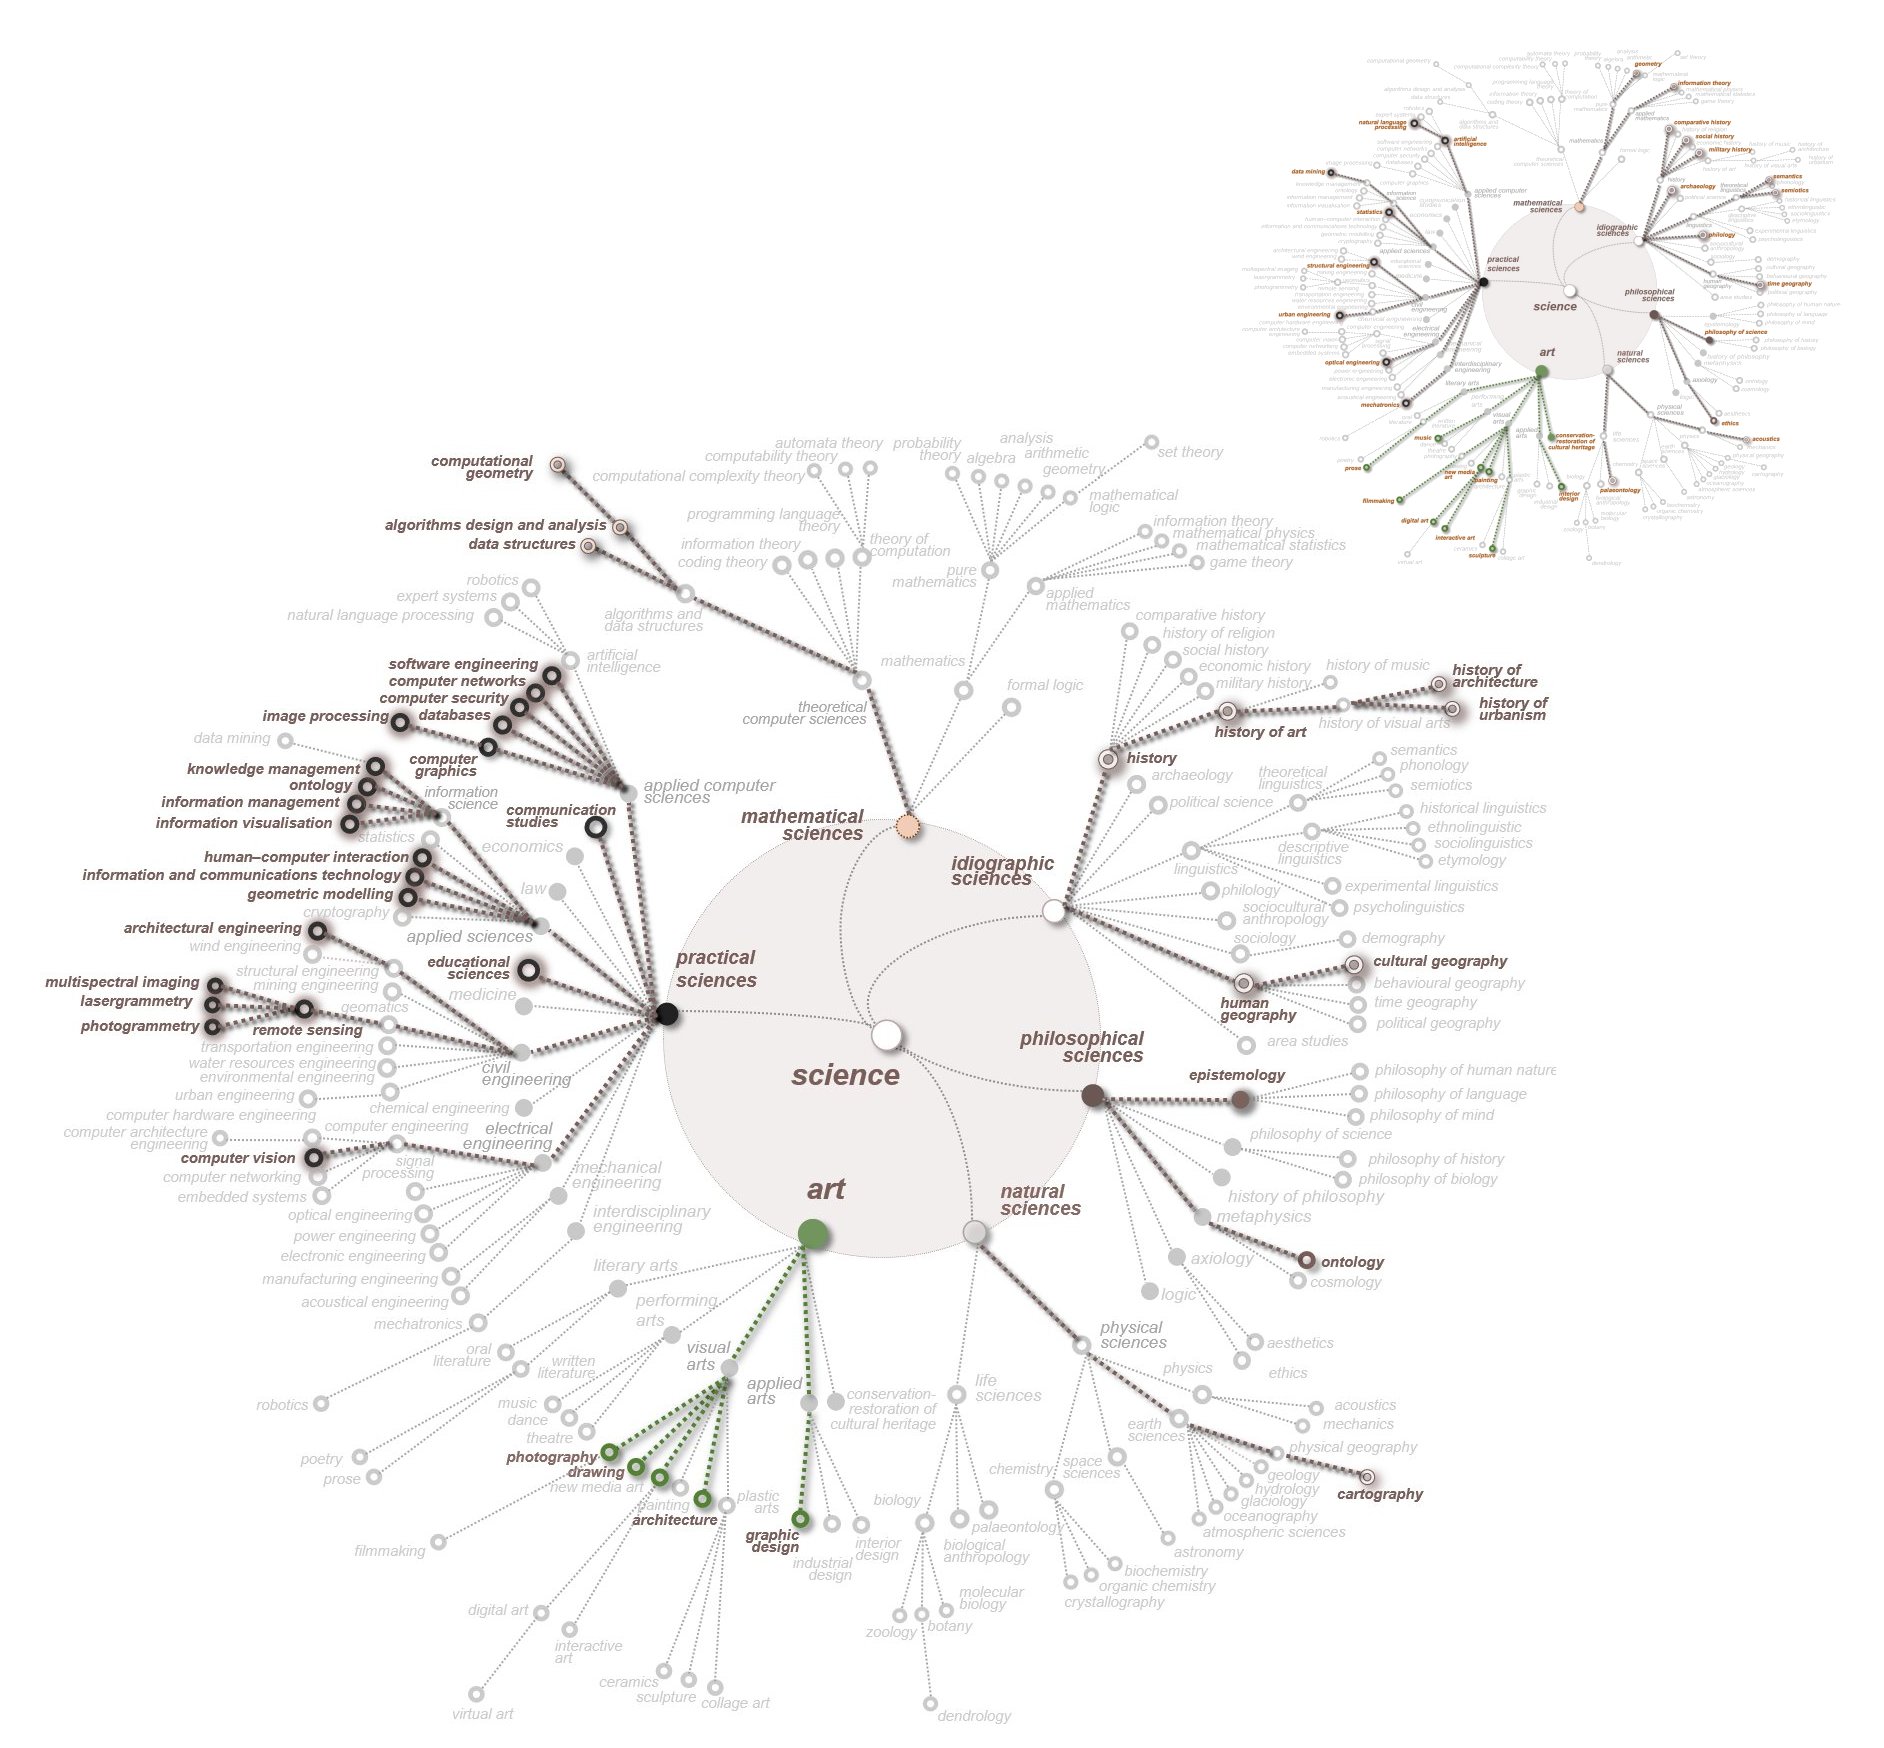
Visualisation activities carried out in the laboratory inherit in fact from two distinct legacies: that of scientific visualisation (representations based on reality – 3D models from survey campaigns, for example) and that of the infovis / visual analytics field (abstract and analytical representations of data, information or knowledge). These distinct practices correspond to the two main divergent points of entry (in terms of methods, technologies and expected added value) through which the laboratory studies Heritage facts and objects:
– Study of an object as it is, based on contemporary observation (3D survey, annotation of 3D point clouds, AR/VR, etc.).
– Study of the information available on an object and its lifeline (historical clues, analogies, theoretical models, etc.).
These practices are illustrated here by a non-exhaustive set of examples from research projects carried out by the laboratory in recent years, including experiments in hybridising the above distinct filiations.
Reality-based 2D/3D environments
Contact: Adeline MANUEL, Anthony PAMART
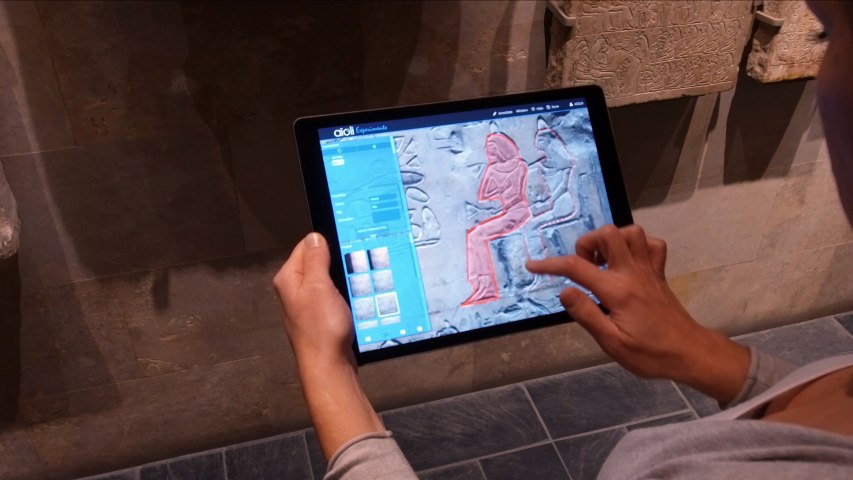
AIOLI
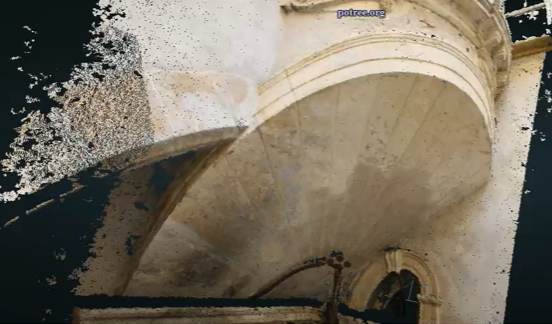
CULTURE 3D CLOUDS (C3DC)
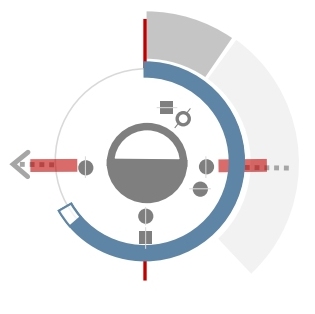
Original infovis solutions
Contact: Jean-Yves Blaise, Iwona DUDEK, Laurent Bergerot
Memoria wheels
Data correlator
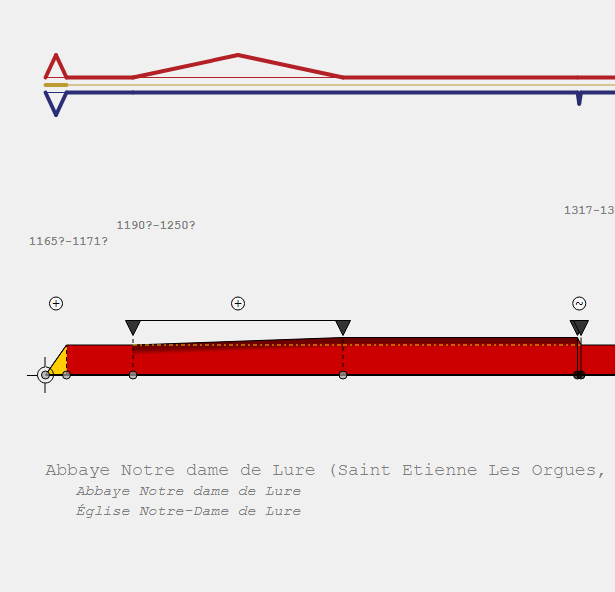
Diachrogrammes
Hybrid experimentations
Contact: Jean-Yves Blaise, Iwona DUDEK, Laurent Bergerot
3D data integrator
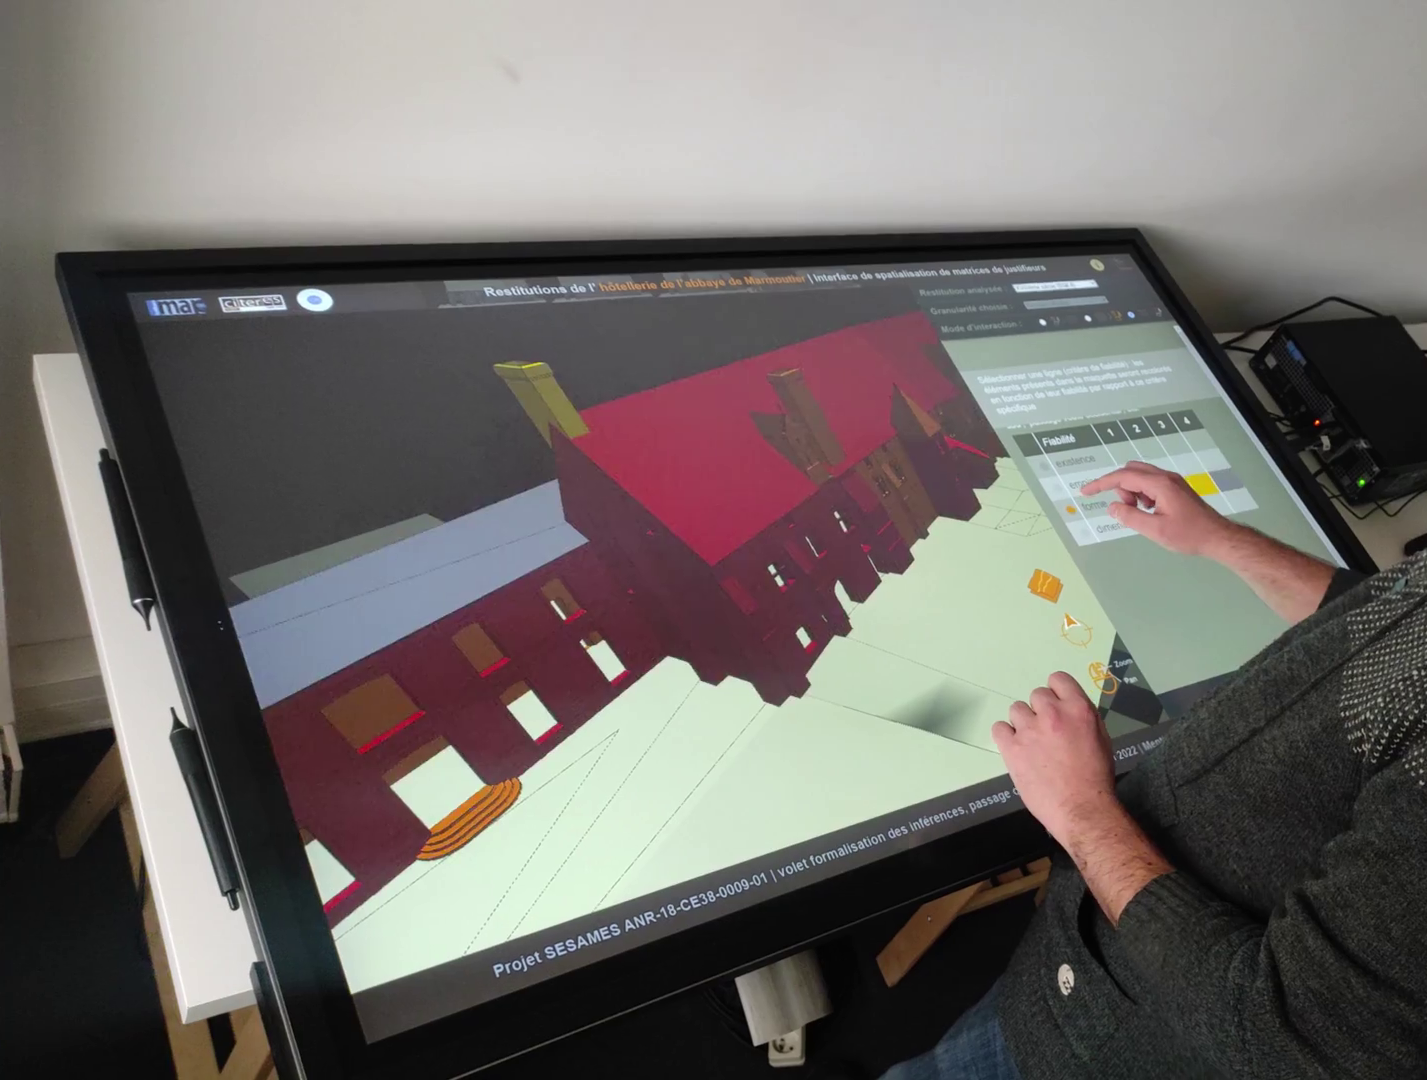
Justifieur
In the past, the laboratory has carried out or led a number of projects involving the 3D representation of reconstruction hypotheses, for communication purposes (Petit Trianon, Marseille treasure trove, Saint-Bénézet bridge in Avignon, etc.).
This form of representation, now more widely used, is no longer at the heart of the laboratory’s practices, but remains a subject of interest in order to address such issues as the interpretability of a 3D reconstruction (evaluation/readability of the notion of plausibility) and reusability of 3D content.