open/close legend
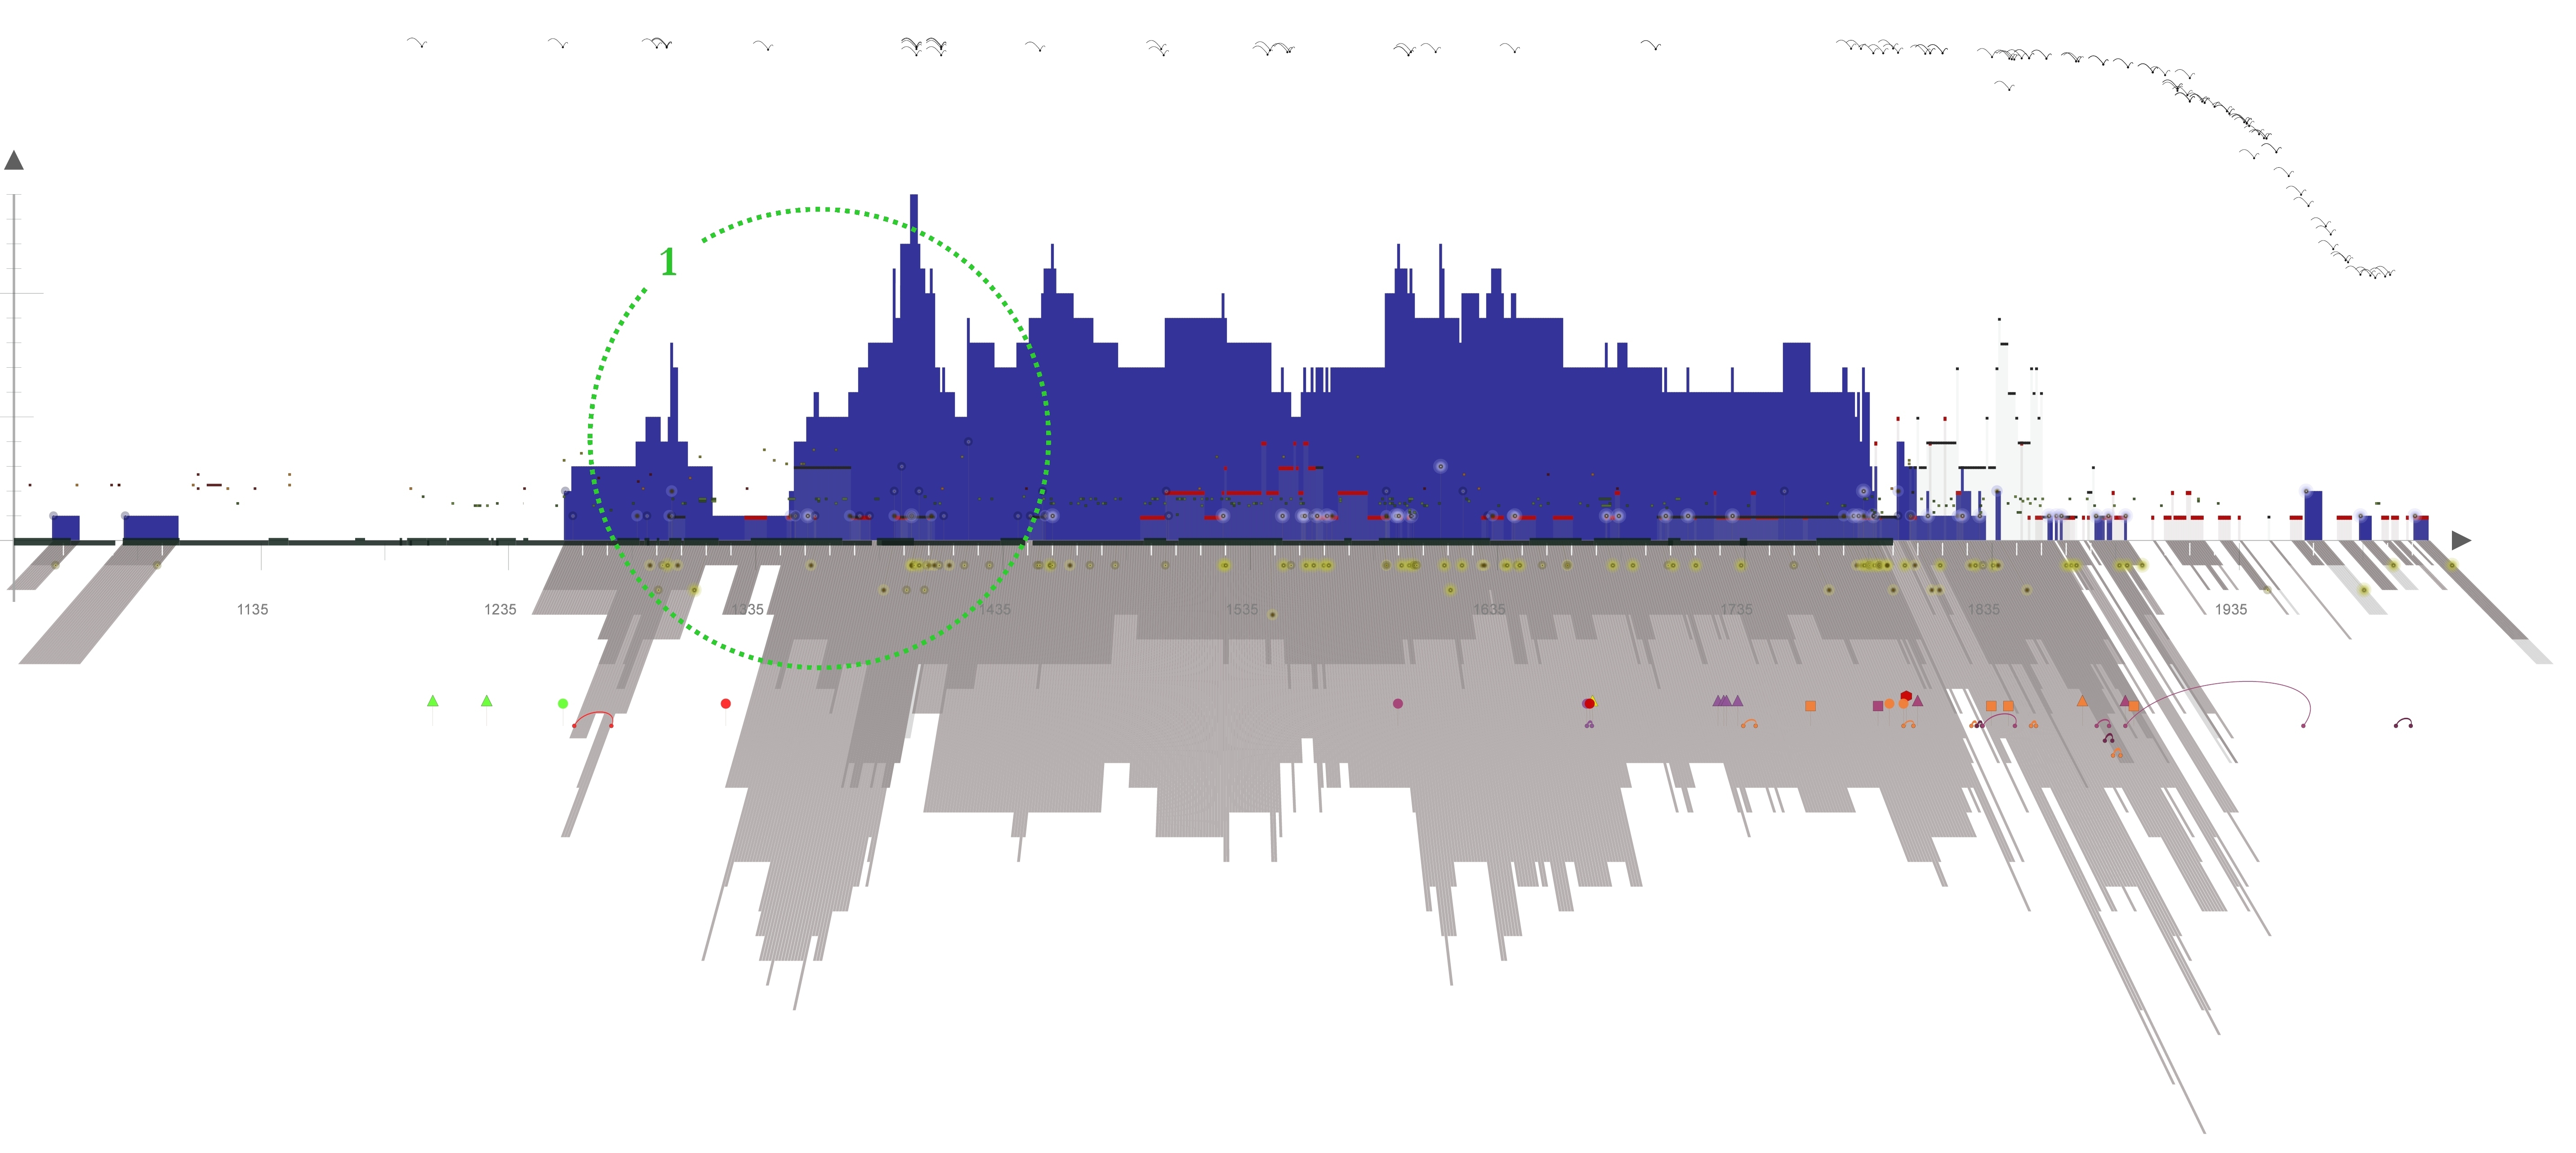
The historySkyline visualisation :
the height of vertical bars represents the amount of transformations across the whole market
square, year by year, since 1035.
Blue bars represent "positive" transformations (creation / modification), red horizontal lines represent
episodic and recurrent changes (maintenance or equivalent), black horizontal lines represent destructive changes.
These indications are correlated with the number of documents available (grey "shadow").
The historySkyline visualisation is here used to highlight the legacy of King Casimir the Great in terms of building activity :
construction, maintenance and destruction during the 14th century.